Crypto Trading for Beginners: Reading a Chart Without Fooling Yourself
14 Aug 2026 · 12 min read
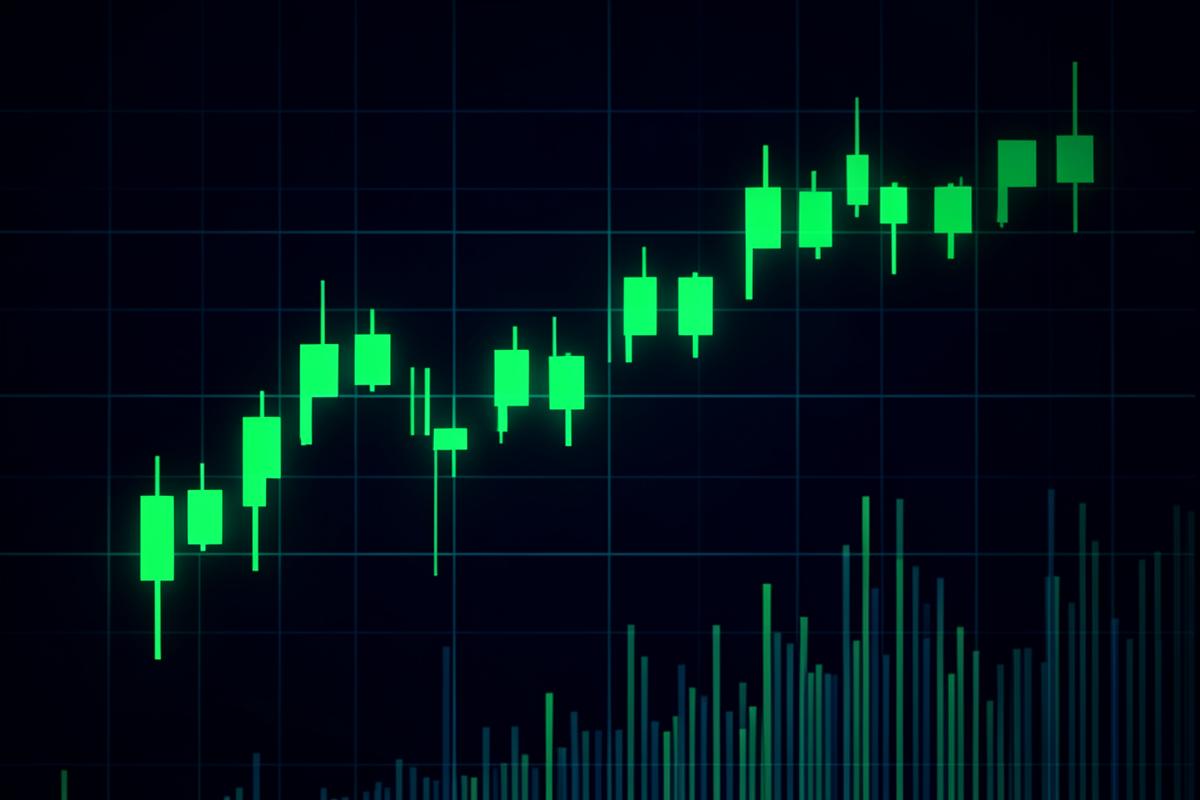
Candles, volume, moving averages and support levels explained gently — along with the psychological traps, false signals and survivorship stories that quietly separate new traders from their money.
Whether you are checking the Bitcoin price today or a year of weekly candles, a chart is a picture of what already happened. That sounds obvious until you notice how often it gets used as a picture of what will happen next. Keeping that distinction alive in your head is more valuable than any indicator you will ever add.
Start with the candle. Each one summarises a period of time with four numbers: the price at the start, the price at the end, and the highest and lowest points in between. The thick body spans open to close; the thin wicks reach the extremes. A long lower wick means sellers pushed the price down and buyers pushed it back before the period closed. That is a description of a tug-of-war, not a promise about the next one.
Timeframe changes the story completely. The same day looks like a violent collapse on a five-minute chart and an unremarkable dip on a weekly one. Beginners tend to watch timeframes far shorter than their actual holding period, which manufactures anxiety and encourages trades they never planned. Match the chart to your horizon: if you intend to hold for years, the daily and weekly views are the only ones worth opening.
Volume tells you how much conviction sat behind a move. A large price jump on tiny volume usually means a thin order book got cleared out, and such moves often retrace quickly. A steady advance on rising volume suggests broader participation. Volume is the single most useful second variable a beginner can learn, and it is free on every chart.
Moving averages smooth the noise by plotting the average price over a trailing window — fifty days, two hundred days. They are useful for one thing: telling you the direction of the medium-term trend at a glance. They are not signals. The famous crossovers get written about because they are easy to name, not because they reliably work; test any such rule over several years of data before you trust a single instance of it.
Support and resistance are levels where price previously stalled. They matter mostly because enough people watch them that behaviour clusters there, which makes them partly self-fulfilling and entirely breakable. Treat them as zones of interest, never as walls. The same goes for the pattern names — head and shoulders, flags, wedges. Human brains find shapes in noise with alarming enthusiasm, and a pattern is only meaningful if you would have identified it before the outcome, not after.
A few traps worth naming outright. Hindsight makes every chart look obvious; scroll back and cover the right-hand side before you judge whether a setup was clear. Social media shows you winning screenshots because losing ones do not get posted. Backtests that look flawless usually contain a subtle peek at future data. And indicator stacking — ten overlays fighting each other — feels like rigour but mostly produces paralysis, because at any moment some of them will disagree.
If you want a starter setup, use this: daily candles, volume, one long moving average, and nothing else. Before entering anything, write down your reason, the price at which you would accept being wrong, and the amount you are willing to lose. Size the position so that being wrong is boring. Then review your notes monthly and look for patterns in your own mistakes rather than in the market.
The uncomfortable truth is that most short-term traders underperform someone who simply bought and held, after fees and taxes are counted. Charts are still worth learning — they help you understand liquidity, timing and risk — but learn them as a way to make calmer decisions, not as a machine for predicting the future.
Key takeaways
- A chart describes what already happened; it does not predict what comes next.
- Match the timeframe to your holding period, or you will manufacture anxiety.
- Volume is the most useful second variable a beginner can learn — and it is free.
- Most short-term traders underperform a simple buy-and-hold after fees and tax.
Disclaimer: This article is educational content, not financial advice. Crypto assets are highly volatile and you can lose everything you put in.
Related reading
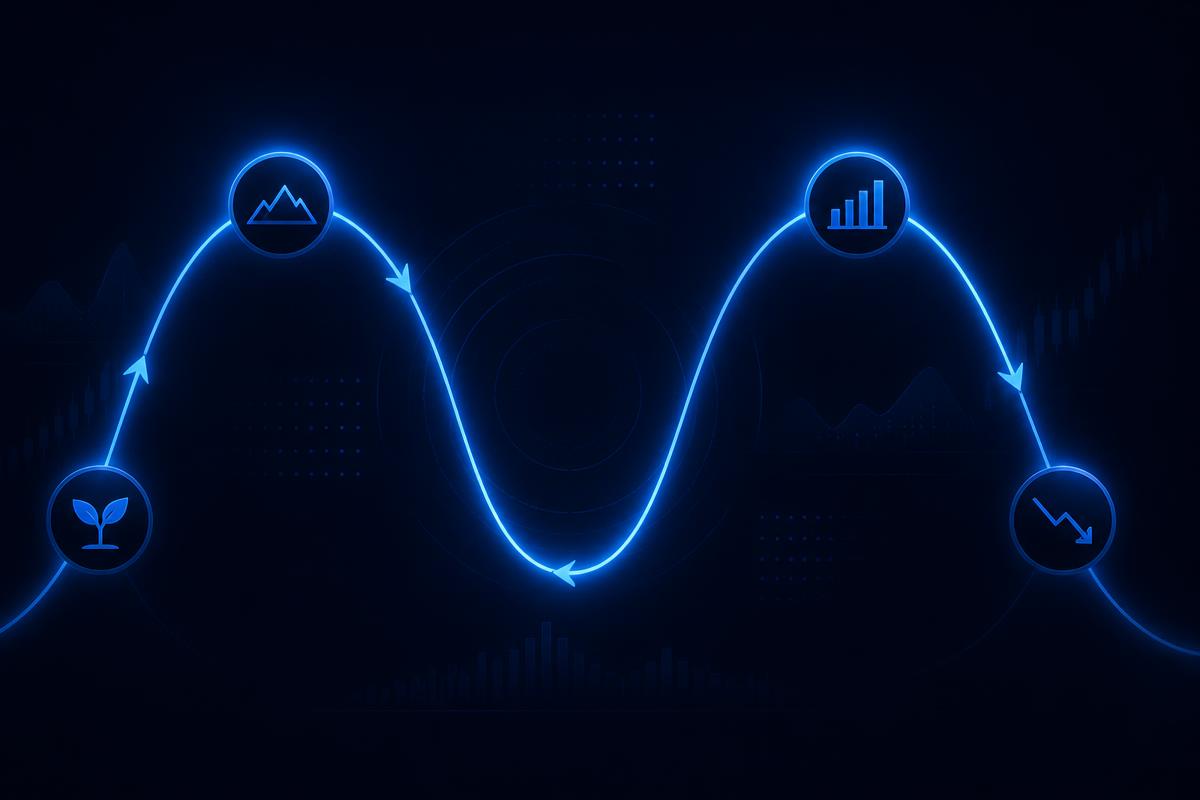
Crypto Market Cycles: What Repeats and What Does Not
Crypto has moved in rough four-year waves since it began, and each one has felt unprecedented from the inside. Here is what genuinely repeats, what is coincidence, and how to use the pattern without betting your savings on it.
13 Sept 2026 · 9 min read
Market Cap, Volume and Bitcoin Dominance: Reading the Numbers
Market cap, volume, fully diluted valuation and Bitcoin dominance are the four numbers on every price page. Each one is useful, each one is routinely misread, and one of them is the reason beginners think cheap coins are cheap.
7 Sept 2026 · 8 min read

How to Start Investing with a Crypto Investment Platform
A step-by-step, no-hype walkthrough of your first months on a crypto investment platform: what to fund before you invest a penny, how to size a position you can sleep through, how to set the account up safely, and what to expect at tax time.
6 Sept 2026 · 10 min read